Sensors specifications and glider integrations
Contents
3. Sensors specifications and glider integrations#
3.1. Nitrate sensors specifications#
3.1.1. UV Spectrometers#
To our knowledge there are currently at least two different instruments for UV spectroscopy nitrate measurements in seawater, one manufactured by Sea-Bird Scientific (USA) called Deep SUNA and one by TriOS (Germany) called OPUS. A similar instrument has been developed in China [Zhu et al., 2021] but is not yet commercially available. Deep SUNAs have been specially developed for use on gliders and Argo floats and have been in use now for several years with good experiences. OPUS instruments have been tested on floats within the Euro-Argo project but not yet on gliders. Both instruments have a 10 mm sample path length in common as this appears to be optimal for the used light sources and spectral sensors and the nitrate concentrations expected in seawater. Apart from these instruments there exists a larger number of submersible nitrate sensors that are optimized for use in freshwater lakes and rivers or for monitoring wastewater (e.g. by YSI; by Xylem). Whether these could be modified for use in seawater and on gliders is not known.
3.1.1.1. Sea-Bird Scientific Deep SUNA#
These instruments are based on the original development by Johnson and Coletti [2002] from MBARI. The original was intended for use in underwater moorings and thus had a more voluminous housing to accommodate batteries. The MBARI-ISUS was commercialized by Satlantic under the same name (Satlantic-ISUS). Satlantic was in 2011 acquired by Sea-Bird Scientific which continues to produce the instruments. Satlantic modified the design of the ISUS which used a mirror together with a light source and a spectrometer next to each other to that of the SUNA which has a light source and a spectrometer on opposing sides of the sample volume. This modified instrument relied on external power and thus was able to have a much more lightweight and streamlined design. The SUNA was further developed into the Deep SUNA which was optimized for the use on autonomous vehicles like gliders or floats with a pressure rating of 2000 dbar and a large internal memory (see also [Johnson et al., 2018]).
All these instruments share the same basic configuration with a Deuterium UV lamp and a 256 channel UV spectrometer covering the wavelengths from 190 to 370 nm. Their internal processor is capable of not only storing the measured spectra but also of converting the data in real time into estimates of the nitrate concentration.
Deep SUNA have so far been attached to Teledyne Webb Research Slocum (see Figure A Teledyne Webb Research Slocum G2 glider with a Deep SUNA attached on top of it.) and ALSEAMAR SeaExplorer gliders.
The Deep SUNA is capable of one measurement per second. Older Slocum gliders (G1 and G2) are however not able to handle more than one measurement every 4 seconds (possibly 2 seconds). Typical use on a glider is thus with a reduced sampling rate of one measurement every 5.5 seconds (GEOMAR). This also significantly reduces the high power consumption while still delivering one measurement per meter depth for fast diving gliders.
The latest version of G3 Slocum gliders should be capable of sampling and recording Deep SUNA data at 1 Hz, but this has to our knowledge not been tested.
Deep SUNA raw data and internally computed Nitrate concentrations are transferred to Slocum gliders via a serial connection. Raw data is in the ‘reduced spectra’ format containing only a limited wavelength range. The full raw data is recorded in the Deep SUNA itself.
Deep SUNA sensors are available with three different anti-fouling options:
none
a copper guard around the sampling volume
a mechanical wiper
The mounting of Deep SUNA sensors on top of gliders and along the main axis of the glider is probably not optimal as the sampling volume of the Deep SUNA is perpendicular to the glider’s movement. At GEOMAR no anti-fouling option has been used so that the water exchange to and from the sample volume is not further decreased.
The nominal energy consumption for a Deep-SUNA given by the manufacturer is 7.5 W. We have to assume that this is the maximum power consumption for the fastest possible sampling rate. This has to be taken into account for mission planning. With a reduced sampling rate of 1 measurement every 5.5 seconds the power consumption is about 1.4 W. This is still significantly higher than the power consumption of the CTD or Aanderaa optodes but comparable to that of Microrider microstructure sensors. For comparison, a Slocum glider with only a CTD diving at full speed uses on average a total of around 5 W.
Deep SUNAs are commercially available and have mounting solutions and data and power transfer cables have been developed for at least Slocum and SeaExplorer gliders.
3.1.1.2. TriOS OPUS#
TriOS (Germany) developed an instrument comparable to the Deep SUNA but decided on a couple of design choices differently. In principle the OPUS measures the same information based also on a 256 channel spectrometer. However, the OPUS’ lamp is a Xenon flash lamp that has a much longer life cycle (typically >109 flashes) than Deuterium lamps (900 h). The spectral characteristics of Xenon flash lamps are however less ideal. They exhibit line-like spectral peaks in the range in which Nitrate absorbs which might make the analysis of the spectra prone to higher uncertainties possibly because of small shifts in the spectra. For single non-averaged spectra the noise level of the OPUS is typically a factor 3 to 8 higher than that of a Deep SUNA. TriOS OPUS are available with a titanium housing with a 6000 dbar pressure rating. This should make them suitable also for deep gliders. The OPUS is capable of making one measurement every 3 seconds (factory configuration is slower possibly because of internal averaging). For a vertical platform speed of 0.1 m/s this results in a vertical resolution of 0.3 m.
For the TriOS OPUS we are not aware of any anti-fouling option. The sampling volume has, however, a shape that allows for a better water exchange.
The specifications of the TriOS OPUS give a power consumption <= 8 W, presumably again at the fastest sampling rate.
We are not aware of any application of a TriOS OPUS on gliders, but once mounting solutions and data and power cables have been developed this should be possible.
3.1.2. Lab-on-Chip (LoC) Instruments#
Lab-on-Chip nitrate+nitrite analysers developed at the National Oceanography Centre, UK have been recently commercialized by ClearWater sensors, UK (https://www.clearwatersensors.com/nitrate-sensor/).
Lab-on-Chip analysers developed at the National Oceanography Centre, and recently commercialized by ClearWater sensors have been successfully deployed on Seagliders to observe key seasonal transitions of biogeochemistry, such as spring bloom dynamics, in the Celtic Sea and North Sea [Vincent et al., 2018], [Hull et al., 2021]. A variant of this sensor that measures phosphate has also been developed and deployed on a Seaglider (Birchill et al, in review).
3.1.2.1. ClearWater (National Oceanography Centre, NOC) Lab-on-Chip analyser#
The LoC analyser contains a three layer poly(methyl methacrylate) (PMMA) optofluidic chip with precision milled microchannels, mixers and optical components consisting of light emitting diodes and photodiodes, electronics, solenoid valves and syringe pumps mounted on the chip. The chip forms the end cap of a dark watertight pressure compensated PVC housing, which is rated to 6000 dbar. The chip is fitted with a cadmium column for the reduction of nitrate to nitrite. The system is automated using a 32 bit microcontroller-based electronics package with 18-bit analogue to digital inputs and can stream raw data (1 Hz) over USB, as well as store data on a 8 GB flash memory card. Provided with the values of the on-board standards, the LoC analyser is capable of outputting processed data (µM NO2-- + NO3--) over RS232 or RS485 interfaces [Beaton et al., 2012]. The analyser is capable of measuring concentrations ranging from 0.025 to 1000 µM NO2-- + NO3-- due to the chip containing 3 measurement cells with differing path lengths. Measurement frequency during glider operations is approximately every 7 minutes, this is preceded by a calibration period of approximately 21 minutes during which blank and standard measurements are made at the start of each dive.
3.2. General considerations of measurements quality control#
The quality of the nitrate concentrations derived from sensors depends on a number of conditions:
time since manufacturer maintenance/calibration (lamp aging)
time in the water (bio-fouling)
cross-calibration availability (via instrument-on-CTD or nearby water samples or other knowledge)
regularity of user calibrations (lamp aging and bio-fouling)
The manufacturers give numbers for the accuracy and the precision of the concentrations delivered by the instruments. They are however only applicable to instruments fresh in the water and with new manufacturer’s calibrations. As soon as instruments are in the water bio-fouling will set in and is not accounted for by the manufacturer’s numbers. Drift because of lamp aging is significant for Deuterium UV lamps and degrades the nominal accuracy very quickly. The precision and detection limit also significantly depend on the availability of temperature and salinity information (see sections on processing).
Note: To get optimal nitrate concentrations frequent cross-calibration against higher quality measurements from water samples is recommended.
Cross-calibration can significantly reduce the overall uncertainty of the nitrate concentrations. Different cross-calibration approaches are possible. The best results will be obtained by attaching the instrument to the CTD and run calibration casts with high quality water sample measurements before and after the deployment. A similar quality should be possible with in-lab calibrations using known reference material before and after the deployment. If neither of these are possible, CTD casts with high quality water samples can be done near the glider and be used to evaluate and possibly correct the instrument concentrations. A priori knowledge of local concentrations can also be used to calibrate albeit at the cost of not being able to detect real deviations from the a priori knowledge. Experiences suggest that the calibration coefficients (for a linear correction) are relatively stable between subsequent deployments [Krahmann et al., 2021].
Table 1: Some specifications for the different instruments.
Please note that it is not known how exactly the manufacturer’s values are determined and whether the same terminology is used. Typically they are valid for recently manufactured and calibrated instruments. Bio-fouling and other influences are not included.
Sample rate |
Power |
Manufacturer Accuracy |
Manufacturer Precision |
Manufacturer Detection limit |
Precision estimate |
Accuracy estimate (w. x-cali.) |
|
|---|---|---|---|---|---|---|---|
Hz |
W |
µM NO3 |
µM NO3- |
µM NO3- |
µM NO3- |
µM NO3- |
|
Deep SUNA |
1 |
<=8 |
10% or >=2.0 (+0.3 / hr lamp) |
0.3 (2.4 SW sal) |
0.5 (2.0 SW sal) |
0.17 (4) |
0.5-1.0 (5) |
OPUS |
1/3 |
<=8 |
5% +0.7 |
0.36 (3) |
2.1 |
1.3 (4) |
1.0 (5) |
LoC |
0.0002 (7 min) |
1.5 |
3 % for concentration range 5.63 to 44.43 (1) |
4 % for concentration range 5.63 to 44.43 (1) |
0.025 |
0.14 (2) |
(1) from estimates of combined uncertainty estimated via the analysis of certified reference materials using 7 analysers [Birchill et al., 2019].
(2) not a standard mode of operation for the LoC analyser, values are from a CTD trial deployment [Vincent et al., 2018].
(3) It is unclear whether the OPUS’ accuracy and precision values given by the manufacturer use internal averaging of several spectra. The typical noise on CTDs was determined using single non-averaged spectra.
(4) The ‘noise’ values have been estimated by calculating the standard deviation of instrument nitrate concentrations at depths with apparently homogeneous nitrate concentrations.
(5) Deep SUNA and OPUS instruments have been used attached to a CTD and high accuracy nitrate concentrations have been compared to Deep SUNA and OPUS values at the time of bottle closing. The given values are the rms difference between the bottle and instrument values after the instrument values have been linearly corrected to match the bottle values
Table 2: Instrument and glider pairs that have successfully been used.
Sensor / Glider |
Slocum |
Autosub/ALR (NOC) |
Seaglider |
Deepglider |
SeaExplorer |
Spray |
|---|---|---|---|---|---|---|
Deep SUNA |
X |
X |
||||
OPUS |
||||||
LoC |
Integration performed by no successful deployment to date |
Yes, via the Autonuts project |
X |
Integration currently being performed |
3.3. Sensor integration with gliders#
3.3.1. UV Spectrometers#
Deep SUNA instruments have to our knowledge been integrated into Slocum and Seaexplorer gliders. Dedicated mounting brackets are needed to mount the instrument on top of the gliders. This position is not optimal since the sampled water volume is in a slit perpendicular to the glider’s movement direction. Whether this has a large influence on the measured values or whether the water exchange through the slit is sufficient has not been tested.
TriOS OPUS have so far not been mounted to gliders.
Regarding the mounting location of UV spectrometers some thought has to be put into the best location of their sampling volume relative to the CTD sensor location. Since the CTD data is used to correct for the influence of salt in the seawater a spatial distance between the sensors might have to be taken into account possibly by time-shifting the CTD data. This is particularly relevant when measuring across strong haloclines and mismatches between the measurements might lead to artifical spikes in the nitrate data. The optimal time shift should be dependent on the vertical and horizontal speed of the glider and the vertical and horizontal separation of the sensors. For Slocum gliders with Deep SUNAs the distance is about 30 cm (15 cm vertical and 20 cm horizontal) which, depending on the glider speed, translates to a 1-2 second long shift. With the typical Slocoum CTD sampling rate of one measurement every 4 seconds and a Deep SUNA sampling rate even slower, this has so far not been compensated for. However for other gliders with a slower speed and a larger separation of the sensors such a correction might be necessary.
3.3.2. Lab-on-Chip Instruments#
The LoC analyser has been successfully integrated into the Ogive Seaglider faring, which allows a larger payload space to accommodate the analyser and reagent storage backs. A custom mounting was used to position the analyser. Any air bubbles in reagent bags should be expelled as much as possible and reflect the conditions under which ballast testing occurred as deviations will affect flight performance. The bags should be backed into the glider bay carefully, avoid snagging any cables and leave space for the Seaglider bladder to expand. Note that waste bags will expand during the deployment and the final volume of waste will also include any sample drawn into the analyser. The sample inlet tube, which extends from the analyser to the hatch cover of the glider, is fitted with a 0.45 µm poly(ether-sulfone) luer lock syringe filter (MERCK, Millipore, USA). The length of the sample inlet tube is minimised to keep its volume as low as possible (to prevent carryover).
The LoC analyser receives power from the Seaglider and is linked via a RS232 serial communication. The Seaglider software uses a CNF file that contains the configuration for each on-board instrument and a CMD file that provides mission parameters. The CNF file enables communication between the Seaglider and the LoC NOx analyser. The LoC analyser is set to ‘logger’ mode in the CNF file, which enables the glider to send a number of commands. These commands allow the Seaglider to send and receive data to and from the analyser. Commands include: ‘clock-set’, used only at the start of each dive, but which enables the analyser to store any time offset between glider and analyser, ‘status’, which sends the analyser depth every 5 s and ‘download’, sent at the end of each dive requesting the sensor to send both ascent and descent data files of processed values. Whilst integration into the Seaglider should be straightforward and follows established procedures available from the National Oceanography Centre, human error (e.g. ‘typos’) and glider firmware updates have caused issues in the past. It is recommended that simulation dives are performed with the sensor and actual deployment glider ahead of the planned deployment.
3.3.3. Mounting location#
3.3.3.1. Spray#
XXX
3.3.3.2. Seaglider#
XXX
3.3.3.3. Slocum#
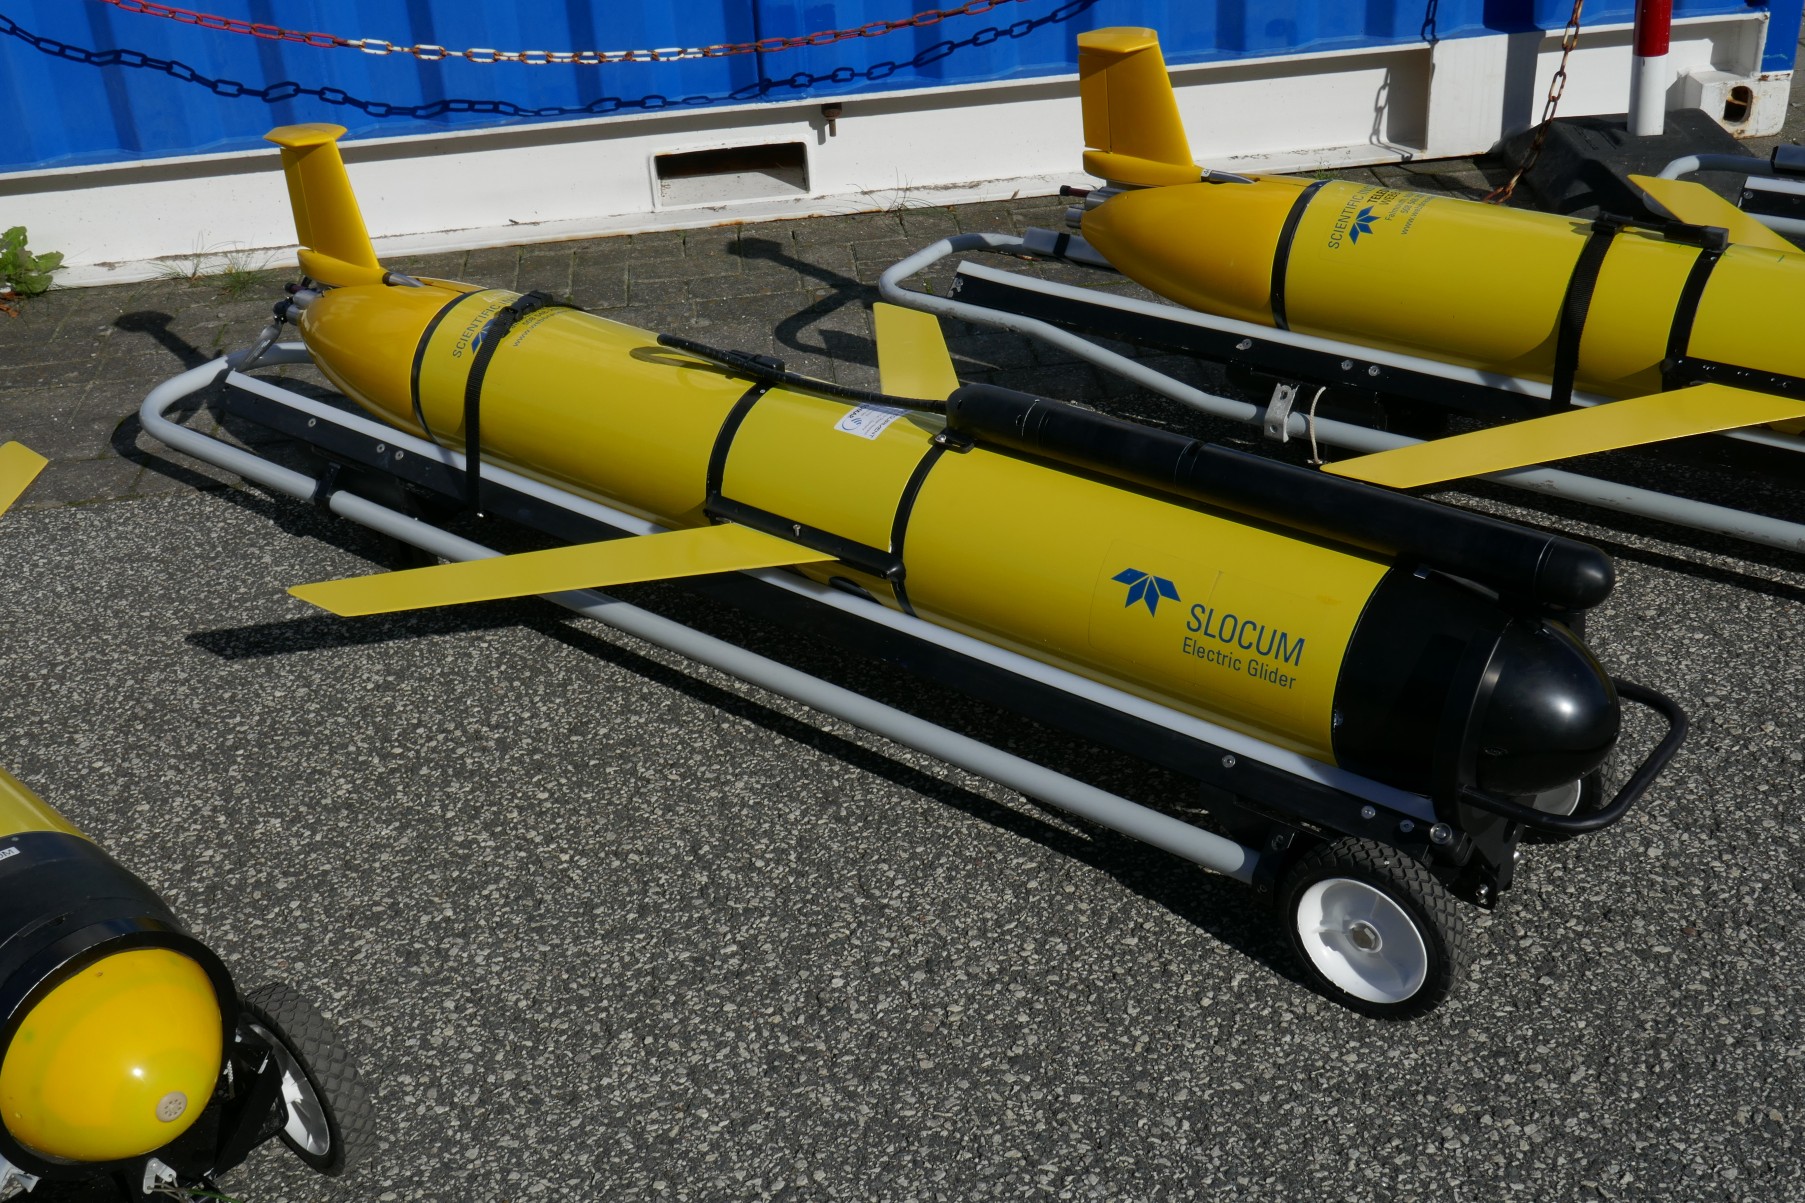
Fig. 3.1 A Teledyne Webb Research Slocum G2 glider with a Deep SUNA attached on top of it.#
3.3.3.4. SeaExplorer#
Fig. 3.2 An ALSEAMAR SeaExplorer X2 with a Deep SUNA attached on the side of the sensor payload section. The sensor attached on the glider nose is a turbulence sensor (MicroRider-1000G by Rockland Scientific). This glider is capable observing the vertical turbulent nitrate flux by combination use of the nitrate and the turbulence sensors.#
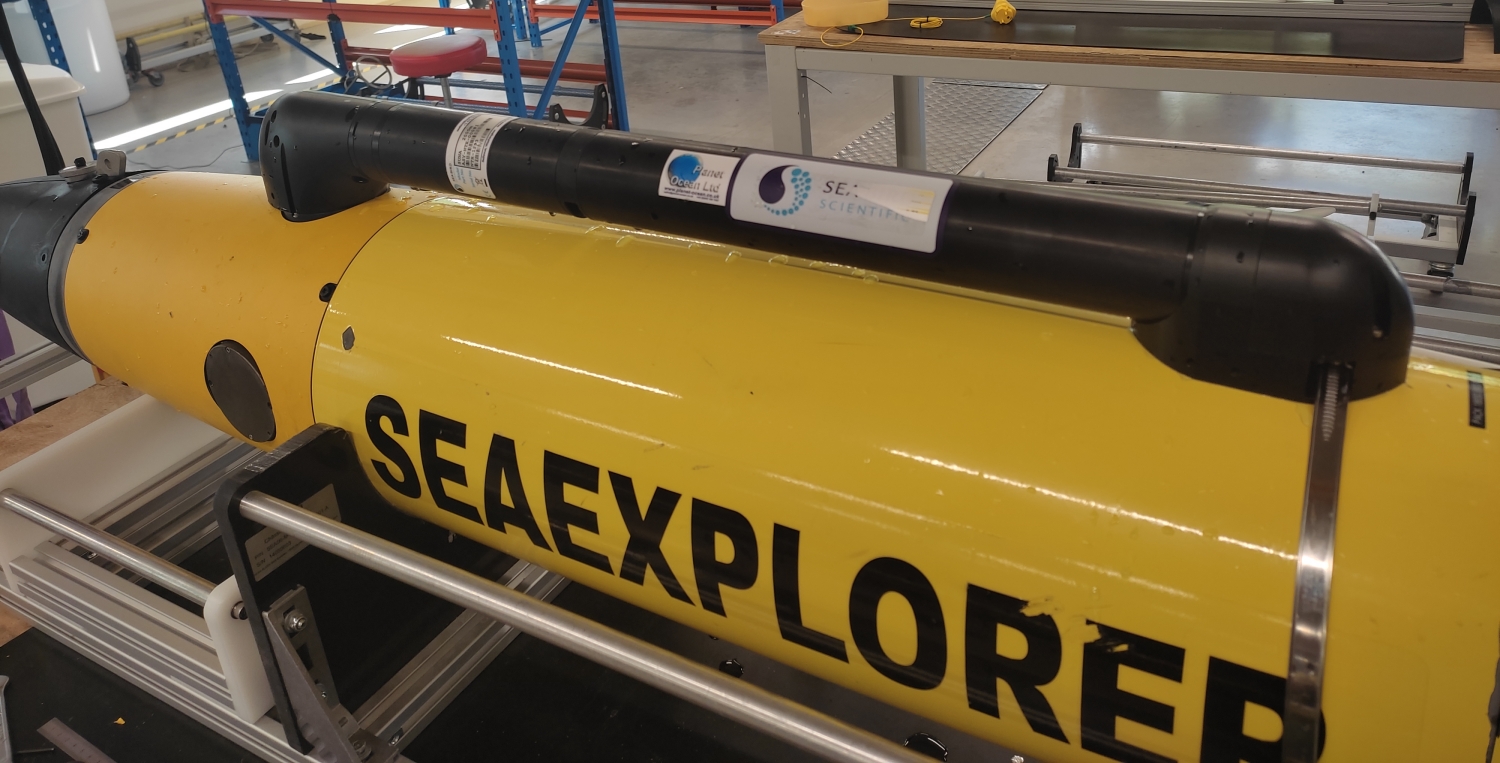
Fig. 3.3 An ALSEAMAR SeaExplorer X2 with a Deep SUNA in a different configuration with the Deep SUNA attached to the top of the glider.#